The framework · Built on 15+ years scaling tech businesses on the continent

The Traction Engine.

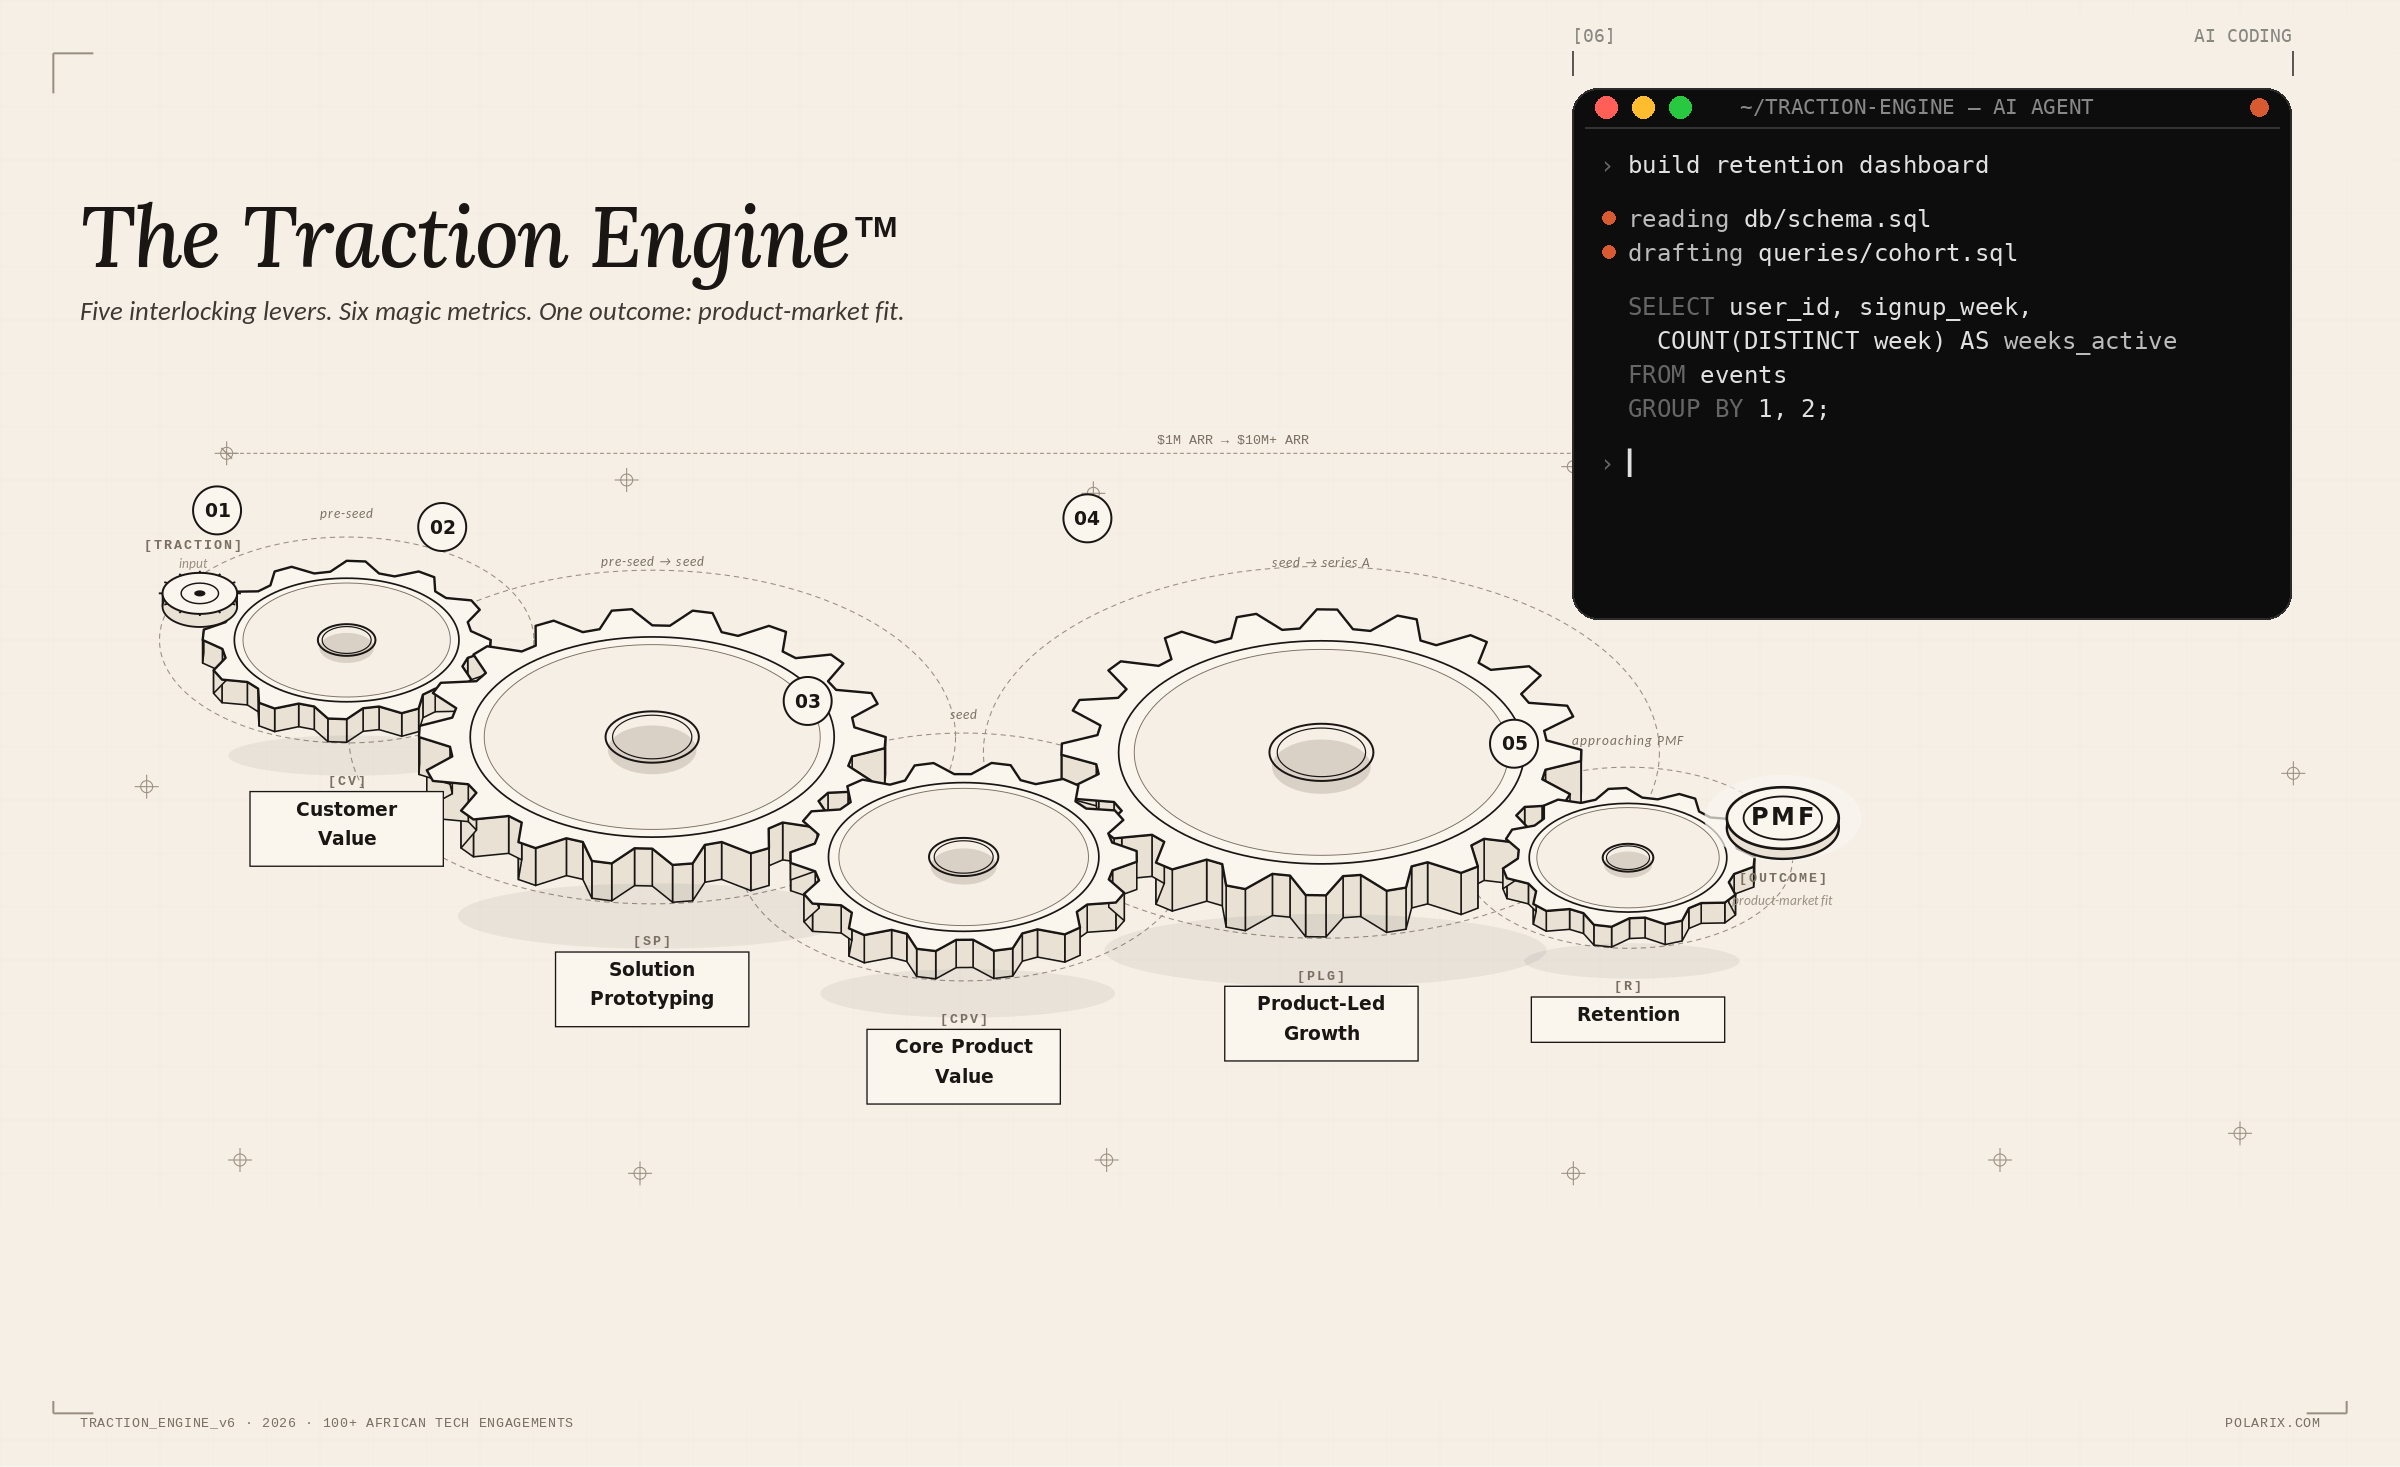
Five interlocking levers. Six growth-health metrics. One job: diagnose, define, and discover the real drivers of long-term sustainable growth.

Growth has a habit of plateauing. The reasons rarely sit in your marketing tactics or ad spend — they sit deeper, in your value proposition, your target customer profile, your core product value, your active-usage curves, and the leading indicators that explain retention before revenue does.

The Traction Engine is the operating system that diagnoses where the real drivers live and gives you a structured plan — five compounding levers, run as AI agents, governed by the leading indicators of revenue — to move them. The spine of every Polarix engagement, and the architecture of every Polarix agent.

The Traction Engine — five interlocking gears representing Customer Value, Solution Prototyping, Core Product Value, Product-Led Growth, and Retention
The 6 magic metrics · leading indicators of compounding growth
>100%
Net revenue retention
<12mo
CAC payback period
>25%
Activation rate
>50%
DAU / MAU
>40%
30-day cohort retention
<2%
Monthly revenue churn
The five levers · diagnostic, compounding

Five levers, run as gears — not a staircase.

Each lever diagnoses a different driver of growth. In practice, you’re pulling two or three at once. Below: the operating spec for each — what it diagnoses, what done looks like, the leading indicators to track, and the plays that move them.

L01 · Customer Value

Diagnose which customer segments compound revenue — and which are eating CAC.


The Win
A refined ICP and named adjacent segments — with hard evidence on which segments actually compound revenue and which don’t.

Signals
  • Net revenue retention by segment
  • Segment-level CAC payback
  • Pipeline velocity by segment
  • Win rate by segment

The Plays
  • ICP refinement under load
  • Win/loss analysis at scale
  • Adjacent segment discovery
  • Churn-driver segmentation
  • Buyer-jobs interviews with active customers
L02 · Solution Prototyping

De-risk feature, segment, and positioning bets before you ship them.


The Win
Validated bets — with buy-intent signal — before the engineering bill arrives.

Signals
  • Validated hypotheses
  • Buy-intent conversion
  • Test cycle time
  • Conviction-to-build score

The Plays
  • Feature & positioning A/B test design
  • Rapid value-prop iteration
  • Segment-specific landing pages
  • Buy-intent signal capture
  • Concierge pilots with named accounts
L03 · Core Product Value

Find where active users disengage — and re-architect the moment of value.


The Win
A measurable lift in activation, time-to-value, and 30/60/90-day cohort retention — the leading indicators of long-term retention.

Signals
  • Activation rate
  • Time-to-value (TTV)
  • 30 / 60 / 90-day cohort retention
  • Feature engagement depth
  • DAU / MAU

The Plays
  • Activation funnel diagnostics
  • Time-to-second-value reduction
  • Onboarding journey rebuilds
  • Cohort behaviour analysis
  • Feature-engagement segmentation
L04 · Product-Led Growth

Build the growth loops. Align the sales motion.


The Win
Compound growth loops running inside the product — paired with a sales motion calibrated to ICP-aligned outbound. CAC payback shortens, pipeline-to-revenue conversion sharpens.

Signals
  • Active-to-registered ratio
  • CAC payback period
  • Pipeline-to-revenue conversion
  • Viral coefficient
  • Growth-loop efficiency

The Plays
  • Growth loop design (referral, content, network)
  • PLG → sales-motion handoff
  • SDR enablement & ICP-aligned outbound
  • Channel concentration strategy
  • Power-user attribution & expansion
L05 · Retention

Diagnose the leak. Re-engineer the value loop. Expansion outpaces churn.


The Win
Sustained net revenue retention above 100% — expansion revenue outpacing churn, payback periods shortening, the value loop compounding under its own weight.

Signals
  • Net revenue retention (NRR)
  • Revenue churn rate
  • CAC payback period
  • Cohort retention curves
  • Expansion revenue per account

The Plays
  • Cohort retention surgery
  • NRR & revenue-churn diagnostics
  • Expansion revenue design
  • Power-user journey mapping
  • Customer success → product feedback loops